Cyborg Trading for Fun and Profit (?)
accept that there’s no plan and follow me
I’ve always liked time. Not time for time’s sake as in the inevitable cessation of time through entropy normalization, but rather time-series data.
I like time-series data, and I cannot lie.
Why is time-series data interesting and useful? Everything in the universe is time-series data. Everything evolves in time (or, if not, others experience time on its behalf). Understanding time gives us the power to splinter the universe.
Here, on our planet, one of the easiest to obtain sources of continually updated time-series data is: price data from the US stock market.
The US stock market processes a couple billion individual trades every day. You can view the live and historical trades-per-day details at places like:
Every stock market trade is logged in public for all to see. When you sold the 1 share of Disney your grandmother gave you in 2013, your trade is recorded. When Jeff Amazon sells $9 billion in stock across 450,000 individual trades over six weeks, each of those trades is recorded in the public stock market ledger for all time, always.
The US stock market is the world’s largest anonymous social network. The public stock market only provides individual trade details of:
- instrument traded
- where trade occurred
- 3 timestamps
- price of trade
- size of trade
- and some additional technical metadata.
We, the people, don’t actually know who did any trade or even if a trade was conducted under motivation of buying or selling (though, you can attempt to guess buy/sell intent if you pair an executed trade against the bid/ask quote snapshot from the instant a trade executed, and the SEC/FINRA/Congress/NSA can always internally de-anonymize any transaction if they think trades look naughty — don’t worry, it only takes them three years to figure out if your $36 billion globally coordinated market manipulation fraud was actually bad or not).
What can us, mere non-centi-billionaire mortals, do with a stock market time-series data though?
The same thing we do with all time-series data: calculate underlying trends over multiple timeframes then alert when trends change in direction or intensity.
These principles and tools can also be adapted to any time-series data like server metrics, high traffic web analytics, network traffic, finance metrics, sensor data, population-level statistics, etc.
Results First
Let’s work backwards and show the results first then the details later.
One problem with live stock market data is there’s no “feeling” behind it. If you sit at your desk with a live updating chart open, then you close your eyes for 5 minutes, can you guess what the stock chart will look like? Absolutely not.
How can we help improve the “feeling the market” problem? What if we let the market be a little voice in your head? Join the chorus.
We must become cyborg. We must become Trading Cyborg. We must become one with the market data until we have reached OHLCV nirvana. Even if you aren’t actively moving money around, you can still experience the market in real time.
I made a speaking API server with nice features like event deadlines and deduplication and priorities. Deadlines and deduplication are important because during high volatility times you don’t want to end up with a backlog queue of 1,000 outdated events speaking continuously long after the underlying events expired. The speaking server also has a built-in recurring schedule speaking support to help remind you to pay attention during certain times of the day.
Converting time-series streaming data into different human sensory inputs is also an experiment in human usability concerns. It’s interesting how we haven’t fully explored (or even attempted to explore?) all the various ways we can help the human experience interface with more data exploration possibilities.
All data in the world doesn’t need to be reduced to just an excel spreadsheet for insight gathering. Consuming information using flat, 2-d human vision interfaces is actually a really inefficient way to consume a wide variety of rapidly changing data (for various biological reasons), but we can also use any sense for data understanding at various levels: stereo hearing, 3-d vision (depth, location in space), color, texture, shape, touch, (smell??), temperature, pressure, face high-dimensionality, pleasure, and pain.
Here are some live output examples (audio on, obviously).
The system as a whole is subscribing to 5 second bars for daily SPXW option symbols (there’s a couple hundred of those) plus a couple dozen primary common instruments to help determine overall market direction across different sectors/themes/asset classes. The underlying thesis for “why this works” is just trading volume happens where price is moving rapidly, so by subscribing to everything then only alerting on what is changing, the system lets the market self-report sensitive or interesting areas automatically. You can’t move price without moving volume, and you can’t move volume without moving price, so any interesting price action causes detectable price and volume anomalies we can process for live reporting.
(with real time anomaly detection, we can also catch “wise guy” trades like when somebody buys an abnormally large $10 million position at exactly the low of the day (often causing the low of the day), then their buy floats up +30% profit in 3 hours… gotta be nice to just passively make $3 million in 3 hours, right? though, sadly, it would only be $1.5MM after taxes.)
of course, this is not “financial advice” (TINFA™) or a trading tutorial or lessons in market mechanics. everything is just examples for demo purposes to show how bender (me) is great, etc
Demo A
Demo B
Others
I would also like to thank the application BackgroundMusic for existing so I could easily record system audio directly into the screen captures.
The intended use case isn’t just to sit and stare at a terminal window speaking to you all day.
The use case is not staring at live data all day, but still being able to know when things are happening in real time. You can feel live market direction with your eyes closed or if you are away from your desk when wearing wireless earbuds, etc.
Here’s some examples of the audio running while looking at dense icli sessions. Maybe hearing uppies/downies alerts helps to focus attention. Visually discerning interesting changes in the screen isn’t always immediately obvious, but audio alerts about what to look at helps.
zoom / enhance
Console A
Console B
More Voice Alert Output Log Examples
Sending interesting data anomalies into awwdio makes it
great for live alerting when things turn into “an avalanche of garbage”
all at once (really wakes you up when you start hearing multiple
“high/low of [double digit] days ago” one after another):
2024-07-24 11:21:41.496 | low OF DAY, ES @ 5492.44
2024-07-24 11:21:43.581 | low OF DAY, AMD @ 146.43
2024-07-24 11:21:45.521 | low OF DAY, RTY @ 2238.16
2024-07-24 11:21:47.680 | low OF DAY, SMH @ 243.76
2024-07-24 11:21:49.674 | low OF DAY, XLK @ 217.33
2024-07-24 11:21:51.626 | AMD LOW OF 54 DAYS
2024-07-24 11:21:52.714 | MSFT LOW OF 27 DAYS
2024-07-24 11:21:54.047 | QQQ LOW OF 27 DAYS
2024-07-24 11:21:55.327 | SMH LOW OF 32 DAYS
2024-07-24 11:21:56.565 | CAT LOW OF 5 DAYS
2024-07-24 11:21:57.578 | SNOW HIGH VOLUME OF 3 DAYS
2024-07-24 11:21:58.730 | SPY LOW OF 14 DAYS
2024-07-24 11:21:59.838 | TSLA HIGH VOLUME OF 3 DAYS
2024-07-24 11:22:01.076 | WMT HIGH VOLUME OF 7 DAYS
2024-07-24 11:22:02.502 | XLK LOW OF 27 DAYS
2024-07-24 11:22:03.732 | low OF DAY, AMD @ 146.34
2024-07-24 11:22:05.610 | low OF DAY, RTY @ 2237.97
2024-07-24 11:22:07.797 | low OF DAY, SMH @ 243.7
2024-07-24 11:22:09.712 | low OF DAY, XLK @ 217.31
2024-07-24 11:22:11.626 | low OF DAY, AMD @ 146.33
2024-07-24 11:22:13.503 | low OF DAY, ES @ 5492.16
2024-07-24 11:22:15.584 | low OF DAY, RTY @ 2237.63
2024-07-24 11:22:17.741 | low OF DAY, SMH @ 243.65
2024-07-24 11:22:19.733 | low OF DAY, XLK @ 217.29
2024-07-24 11:22:21.649 | put YELLOW VOLUME RAMP 5 4 2 zero  SPXW
2024-07-24 11:22:25.399 | MSFT LOW OF 27 DAYS
2024-07-24 11:22:26.634 | AMD LOW OF 54 DAYS
2024-07-24 11:22:27.754 | CAT LOW OF 5 DAYS
2024-07-24 11:22:28.778 | QQQ LOW OF 27 DAYS
2024-07-24 11:22:30.048 | SMCI LOW OF 54 DAYS
2024-07-24 11:22:31.210 | SMH LOW OF 32 DAYS
2024-07-24 11:22:32.453 | SPY LOW OF 14 DAYS
2024-07-24 11:22:33.489 | TSM LOW OF 30 DAYS
2024-07-24 11:22:34.602 | XLK LOW OF 27 DAYS
2024-07-24 11:23:07.922 | META LOW OF 2 DAYS
2024-07-24 11:23:13.654 | low OF DAY, AMD @ 146.26
2024-07-24 11:23:15.529 | low OF DAY, ASML @ 891.93
2024-07-24 11:23:17.536 | low OF DAY, ES @ 5491.08
2024-07-24 11:23:19.605 | low OF DAY, RTY @ 2237.86 (repeated 2)
2024-07-24 11:23:22.128 | low OF DAY, SMCI @ 713.96
2024-07-24 11:23:24.144 | low OF DAY, SMH @ 243.61 (repeated 2)
or this batch:
2024-07-24 11:48:06.859 | AMD LOW OF 54 DAYS
2024-07-24 11:48:07.956 | AMZN LOW OF 1 DAYS
2024-07-24 11:48:08.951 | ARM LOW OF 2 DAYS
2024-07-24 11:48:09.895 | AVGO LOW OF 26 DAYS
2024-07-24 11:48:11.054 | COST LOW OF 2 DAYS
2024-07-24 11:48:12.054 | GME LOW OF 10 DAYS
2024-07-24 11:48:13.017 | ANET LOW OF 2 DAYS
2024-07-24 11:48:14.004 | META LOW OF 3 DAYS
2024-07-24 11:48:15.000 | QQQ LOW OF 27 DAYS
2024-07-24 11:48:16.291 | SMCI LOW OF 55 DAYS
2024-07-24 11:48:17.494 | SMH LOW OF 32 DAYS
2024-07-24 11:48:18.717 | SNOW HIGH VOLUME OF 3 DAYS
2024-07-24 11:48:19.891 | SNOW LOW OF 17 DAYS
2024-07-24 11:48:21.028 | SPY LOW OF 14 DAYS
2024-07-24 11:48:22.120 | XLK LOW OF 27 DAYS
2024-07-24 11:48:23.392 | low OF DAY, AMD @ 145.71
2024-07-24 11:48:25.320 | low OF DAY, AMZN @ 181.06
2024-07-24 11:48:27.275 | low OF DAY, AMD @ 145.63
2024-07-24 11:48:29.234 | low OF DAY, AMZN @ 180.97
2024-07-24 11:48:31.083 | low OF DAY, ANF @ 154.83
2024-07-24 11:48:32.937 | low OF DAY, ARM @ 158.98 (repeated 2)
2024-07-24 11:48:35.077 | low OF DAY, ASML @ 888.98
2024-07-24 11:48:37.015 | low OF DAY, AVGO @ 152.98 (repeated 2)
2024-07-24 11:48:39.345 | low OF DAY, ES @ 5484.58 (repeated 2)
2024-07-24 11:48:41.775 | AMD LOW OF 54 DAYS
2024-07-24 11:48:42.890 | AMZN LOW OF 1 DAYS
2024-07-24 11:48:43.885 | ARM LOW OF 2 DAYS
2024-07-24 11:48:44.903 | AVGO LOW OF 26 DAYS
2024-07-24 11:48:46.055 | ANET LOW OF 2 DAYS
2024-07-24 11:48:47.021 | GME LOW OF 9 DAYS
2024-07-24 11:48:48.040 | META LOW OF 3 DAYS
2024-07-24 11:48:49.062 | NVDA LOW OF 32 DAYS
2024-07-24 11:48:50.143 | QQQ LOW OF 27 DAYS
2024-07-24 11:48:51.423 | ASML LOW OF 53 DAYS
2024-07-24 11:48:52.583 | CAT LOW OF 5 DAYS
2024-07-24 11:48:53.638 | PANW LOW OF 1 DAYS
2024-07-24 11:48:54.610 | SHOP LOW OF 32 DAYS
2024-07-24 11:48:55.694 | SMCI LOW OF 55 DAYS
2024-07-24 11:48:56.899 | SMH LOW OF 32 DAYS
2024-07-24 11:48:58.124 | SNOW HIGH VOLUME OF 3 DAYS
2024-07-24 11:48:59.293 | SPY LOW OF 23 DAYS
2024-07-24 11:49:00.466 | TSM LOW OF 30 DAYS
2024-07-24 11:49:01.626 | UVXY HIGH OF 34 DAYS
2024-07-24 11:49:02.820 | UVXY HIGH VOLUME OF 7 DAYS
2024-07-24 11:49:04.088 | XLK LOW OF 27 DAYS
2024-07-24 11:49:05.390 | low OF DAY, AMD @ 145.6
2024-07-24 11:49:07.235 | ANF LOW OF 2 DAYS
2024-07-24 11:49:08.207 | COST LOW OF 2 DAYS
2024-07-24 11:49:09.163 | low OF DAY, ANF @ 154.64
2024-07-24 11:49:11.067 | low OF DAY, ARM @ 158.81
2024-07-24 11:49:12.816 | low OF DAY, AMZN @ 180.92
2024-07-24 11:49:14.678 | low OF DAY, ARM @ 158.7
2024-07-24 11:49:16.419 | AMZN LOW OF 1 DAYS
2024-07-24 11:49:17.403 | ANET LOW OF 2 DAYS
2024-07-24 11:49:18.352 | ARM LOW OF 2 DAYS
2024-07-24 11:49:19.276 | ASML LOW OF 53 DAYS
2024-07-24 11:49:20.386 | NVDA LOW OF 32 DAYS
2024-07-24 11:49:21.492 | PANW LOW OF 1 DAYS
2024-07-24 11:49:22.480 | QQQ LOW OF 27 DAYS
2024-07-24 11:49:23.757 | SHOP LOW OF 32 DAYS
2024-07-24 11:49:24.813 | SMCI LOW OF 55 DAYS
2024-07-24 11:49:25.951 | SMH LOW OF 32 DAYS
Here’s an interesting one where ANET broke under a month
long support, which I wouldn’t have noticed in real time without these
voice alerts (the alerts jumped from “LOW OF 2 DAYS” to “LOW OF 23
DAYS”):
2024-07-24 12:10:11.865 | low OF DAY, JPM @ 208.98
2024-07-24 12:10:15.571 | UVXY HIGH VOLUME OF 7 DAYS
2024-07-24 12:10:16.805 | JPM LOW OF 1 DAYS
2024-07-24 12:10:20.332 | put DISTRIBUTION 5 4 3 zero  SPXW
2024-07-24 12:10:22.485 | call T-T CROSS UP 5 4 4 zero  SPXW (repeated 2)
2024-07-24 12:10:26.057 | ANET LOW OF 2 DAYS
2024-07-24 12:10:40.272 | put DISTRIBUTION 5 4 2 zero  SPXW
2024-07-24 12:10:42.429 | call ACCUMULATION 5 4 4 zero  SPXW (repeated 2)
2024-07-24 12:10:45.137 | call ACCUMULATION 5 4 5 zero  SPXW
2024-07-24 12:10:47.445 | put DISTRIBUTION 5 4 3 zero  SPXW
2024-07-24 12:10:50.601 | JPM LOW OF 1 DAYS
2024-07-24 12:10:51.707 | UVXY HIGH VOLUME OF 7 DAYS
2024-07-24 12:11:00.294 | put DISTRIBUTION 5 4 2 zero  SPXW
2024-07-24 12:11:02.435 | call ACCUMULATION 5 4 4 zero  SPXW (repeated 2)
2024-07-24 12:11:05.158 | call ACCUMULATION 5 4 5 zero  SPXW
2024-07-24 12:11:07.450 | ANET LOW OF 2 DAYS
2024-07-24 12:11:08.378 | put DISTRIBUTION 5 4 3 zero  SPXW
2024-07-24 12:11:25.396 | META LOW OF 3 DAYS
2024-07-24 12:11:26.351 | SNOW HIGH VOLUME OF 3 DAYS
2024-07-24 12:11:27.523 | UVXY HIGH VOLUME OF 7 DAYS
2024-07-24 12:11:28.734 | low OF DAY, META @ 461.73
2024-07-24 12:11:30.595 | ANET LOW OF 23 DAYS
2024-07-24 12:11:40.416 | put EMA CROSS-DOWN 5 4 3 zero  SPXW
2024-07-24 12:12:00.373 | WMT HIGH VOLUME OF 7 DAYS
2024-07-24 12:12:01.783 | TLT HIGH VOLUME OF 7 DAYS
2024-07-24 12:12:03.097 | UVXY HIGH VOLUME OF 7 DAYS
2024-07-24 12:12:05.543 | ANET LOW OF 23 DAYS
2024-07-24 12:12:06.672 | SNOW HIGH VOLUME OF 3 DAYS
2024-07-24 12:12:35.567 | WMT HIGH VOLUME OF 7 DAYS
2024-07-24 12:12:36.975 | META LOW OF 3 DAYS
2024-07-24 12:12:37.978 | SNOW HIGH VOLUME OF 3 DAYS
2024-07-24 12:12:39.132 | TLT HIGH VOLUME OF 7 DAYS
2024-07-24 12:12:40.388 | UVXY HIGH VOLUME OF 7 DAYS
2024-07-24 12:12:41.643 | low OF DAY, META @ 461.65
2024-07-24 12:12:43.538 | call DISTRIBUTION 5 4 4 zero  SPXW (repeated 4)
2024-07-24 12:12:46.177 | put ACCUMULATION 5 4 3 zero  SPXW (repeated 2)
2024-07-24 12:12:48.887 | put OBV 5 4 3 zero  SPXW (repeated 3)
2024-07-24 12:13:00.521 | put ACCUMULATION 5 4 3 zero  SPXW
2024-07-24 12:13:02.738 | call DISTRIBUTION 5 4 4 zero  SPXW (repeated 2)
2024-07-24 12:13:10.676 | ANET LOW OF 23 DAYS
2024-07-24 12:13:20.543 | put ACCUMULATION 5 4 3 zero  SPXW
2024-07-24 12:13:42.212 | low OF DAY, META @ 461.63
2024-07-24 12:13:45.932 | META LOW OF 3 DAYS
and it’s always great when everything just collapses at the end of a day:
2024-07-24 12:52:10.937 | low OF DAY, ES @ 5472.92
2024-07-24 12:52:13.018 | low OF DAY, GME @ 23.98
2024-07-24 12:52:14.747 | low OF DAY, RTY @ 2216.17
2024-07-24 12:52:16.883 | ANET LOW OF 25 DAYS
2024-07-24 12:52:18.091 | SPY LOW OF 24 DAYS
2024-07-24 12:52:19.251 | TSM LOW OF 31 DAYS
2024-07-24 12:52:20.471 | UVXY HIGH OF 34 DAYS
2024-07-24 12:52:21.595 | XLF LOW OF 5 DAYS
2024-07-24 12:52:22.743 | low OF DAY, XLF @ 42.65
2024-07-24 12:52:24.516 | call DISTRIBUTION 5 4 3 zero  SPXW
2024-07-24 12:52:26.774 | low OF DAY, ES @ 5471.51
2024-07-24 12:52:28.898 | low OF DAY, JPM @ 208.38
2024-07-24 12:52:30.675 | CAT LOW OF 6 DAYS
2024-07-24 12:52:31.664 | low OF DAY, RTY @ 2215.27
2024-07-24 12:52:33.769 | low OF DAY, XLF @ 42.63
Collective Soul Trends
How do we generate all the historical high/low values to compare prices against in real time?
If we maintain a local database of price data, we can manipulate it arbitrarily:
Sample Query Over Trending
SELECT
    toDate(time) AS When,
    volume,
    lagInFrame(vw) OVER (ROWS BETWEEN UNBOUNDED PRECEDING AND UNBOUNDED FOLLOWING) AS lvw,
    vw,
    round(vw - lvw, 2) AS DayChange,
    round(((vw / lvw) - 1) * 100, 2) AS pct,
    round(lagInFrame(high) OVER (ROWS BETWEEN UNBOUNDED PRECEDING AND UNBOUNDED FOLLOWING), 2) AS lhigh,
    round(lagInFrame(low) OVER (ROWS BETWEEN UNBOUNDED PRECEDING AND UNBOUNDED FOLLOWING), 2) AS llow,
    round(max(high) OVER (ROWS BETWEEN 8 PRECEDING AND CURRENT ROW), 2) AS lhigh7,
    round(min(low) OVER (ROWS BETWEEN 8 PRECEDING AND CURRENT ROW), 2) AS llow7,
    if((high - lhigh) > 0, round(high - lhigh, 2), 0) AS BiggerHigh,
    if((low - llow) < 0, round(low - llow, 2), 0) AS SmallerLow,
    if((high - lhigh7) > 0, round(high - lhigh7, 2), 0) AS BiggerHigh7,
    if((low - llow7) < 0, round(low - llow7, 2), 0) AS SmallerLow7,
    if((low - lhigh) > 0, round(low - lhigh, 2), 0) AS HigherLow,
    if((high - llow) < 0, round(high - llow, 2), 0) AS LowerLow,
    lvw < vw AS Green,
    round(exponentialMovingAverage(0.5)(vw, rowNumberInAllBlocks()) OVER (ROWS BETWEEN UNBOUNDED PRECEDING AND CURRENT ROW), 2) AS EXP1,
    round(exponentialMovingAverage(1)(vw, rowNumberInAllBlocks()) OVER (ROWS BETWEEN UNBOUNDED PRECEDING AND CURRENT ROW), 2) AS EXP2,
    round(exponentialMovingAverage(2)(vw, rowNumberInAllBlocks()) OVER (ROWS BETWEEN UNBOUNDED PRECEDING AND CURRENT ROW), 2) AS EXP2WIDE,
    EXP1 > EXP2 AS GoingUp,
    EXP1 > EXP2WIDE AS GoingUpWide,
    round(high - low, 2) AS RangeOfDay,
    round(exponentialMovingAverage(0.5)(high - low, rowNumberInAllBlocks()) OVER (ROWS BETWEEN UNBOUNDED PRECEDING AND CURRENT ROW), 2) AS RR1,
    round(exponentialMovingAverage(1)(high - low, rowNumberInAllBlocks()) OVER (ROWS BETWEEN 10 PRECEDING AND CURRENT ROW), 2) AS RR2,
    round(exponentialMovingAverage(2)(high - low, rowNumberInAllBlocks()) OVER (ROWS BETWEEN 5 PRECEDING AND CURRENT ROW), 2) AS RR2WIDE,
    RR1 > RR2 AS RangeUp,
    RR1 > RR2WIDE AS RangeUpWide
FROM stonks1d
FINAL
WHERE sym = 'SPY'
ORDER BY time DESC
LIMIT 60
which gives us results like these (uh, probably click to full size):

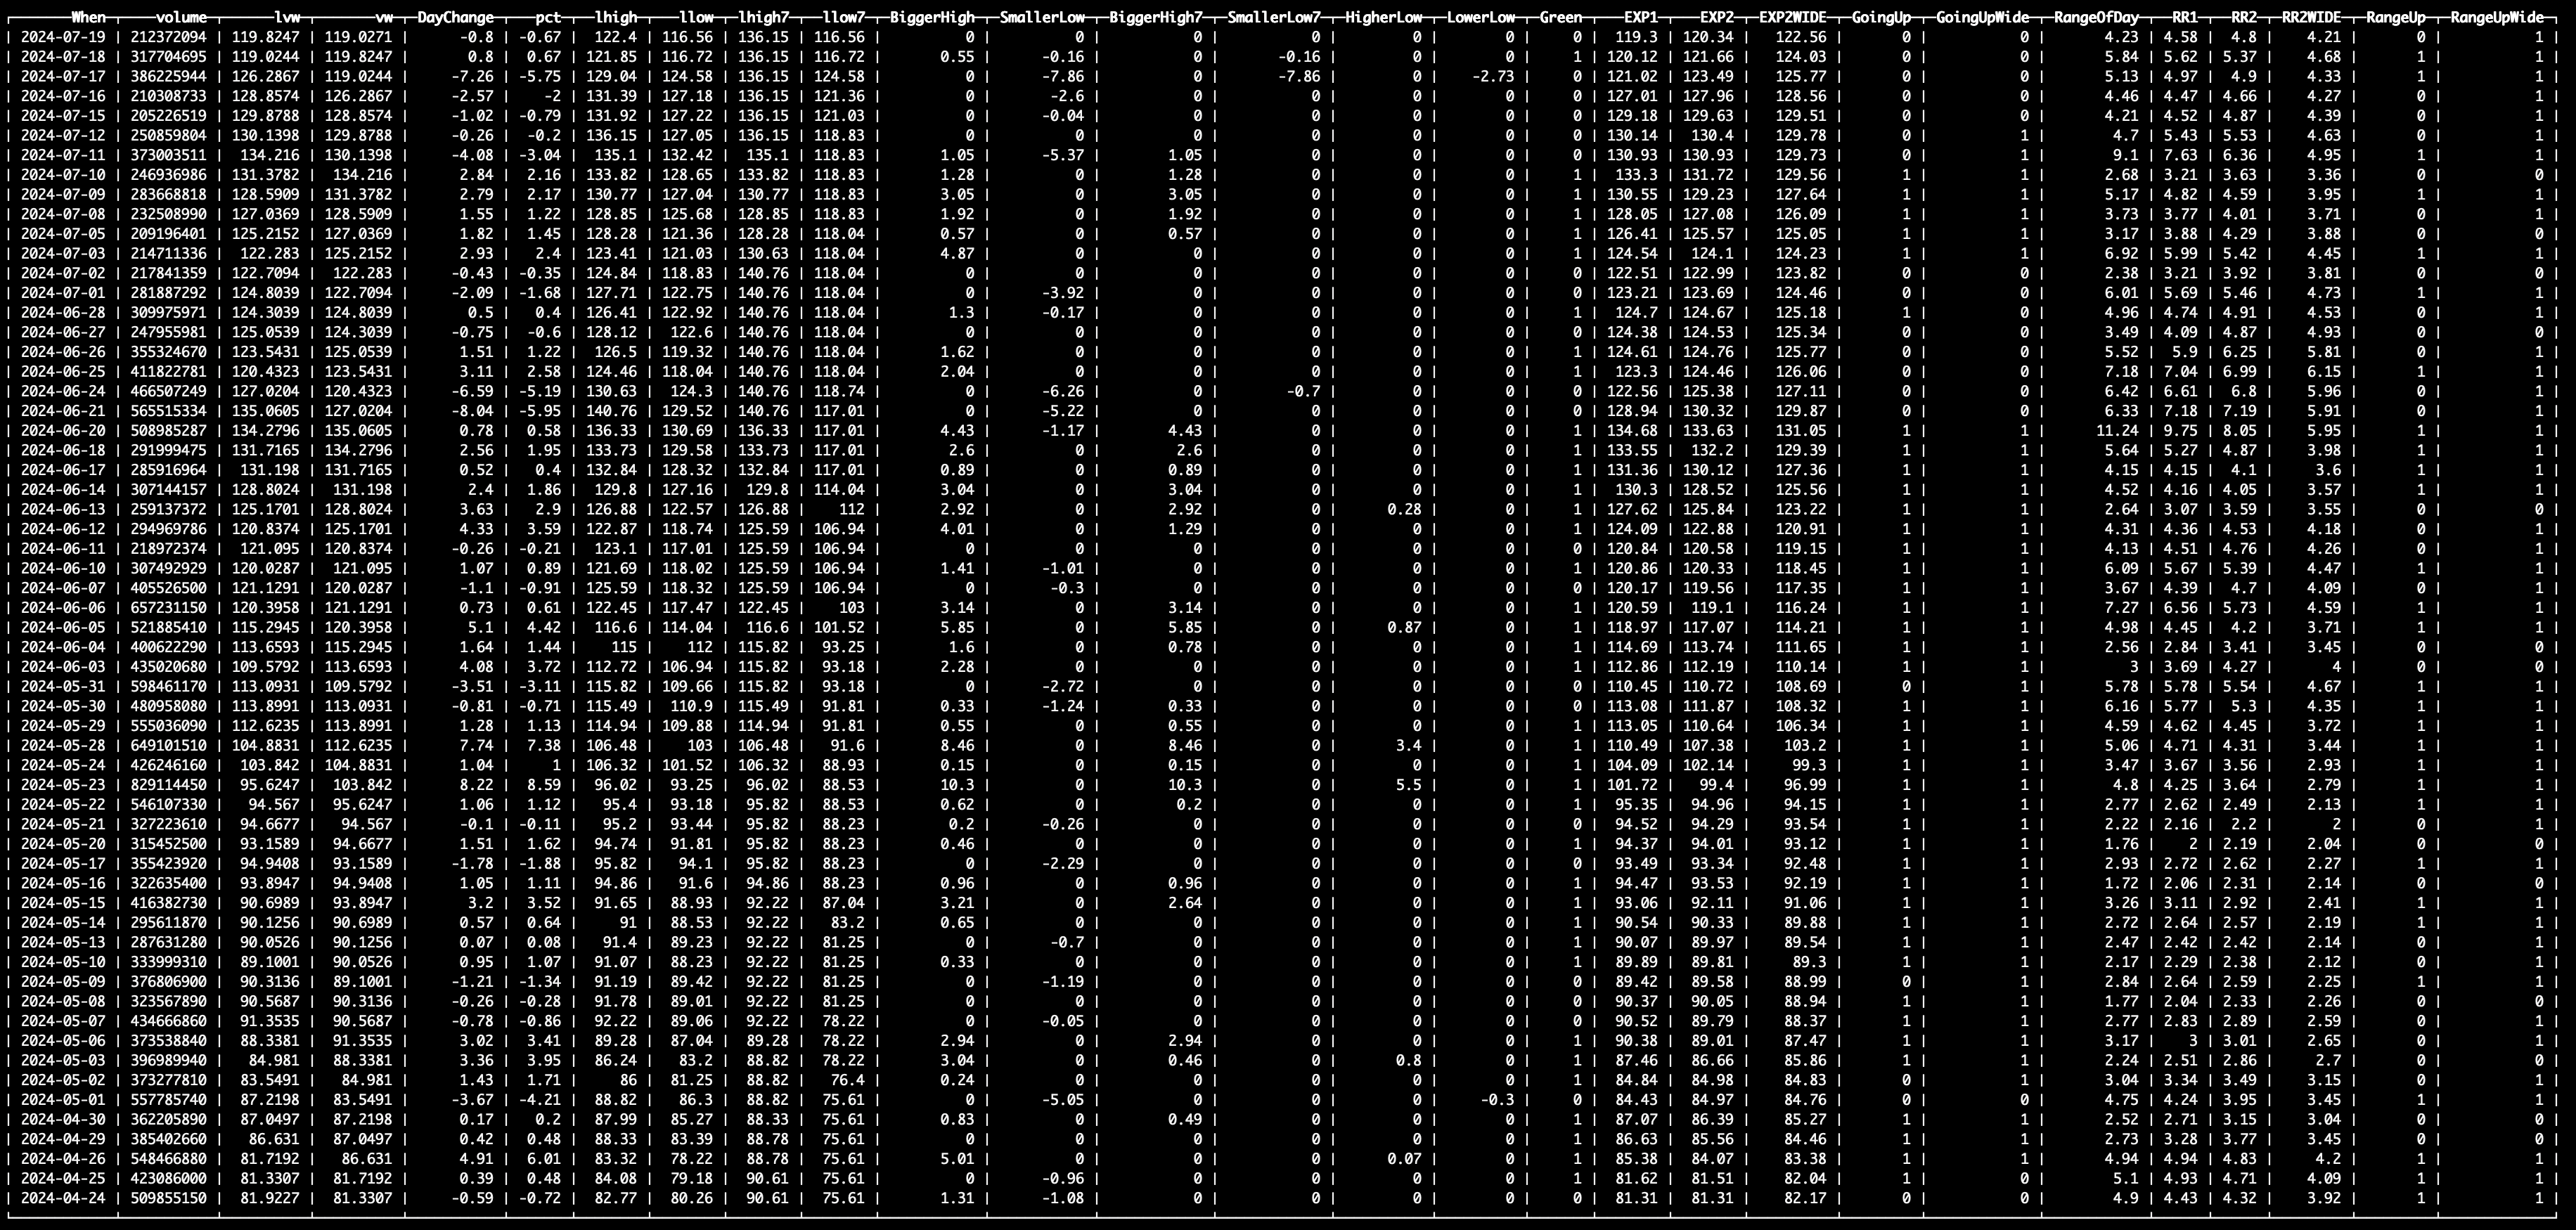


Table Layout
Here’s the table layout used for those queries (this is both the highest performing and smallest storage size stock data schema I’ve found across all configuration combinations):
SHOW CREATE TABLE stonks1d

Query id: d20b0ac6-871a-433f-8b56-fdc279c89a14

Row 1:
──────
statement: CREATE TABLE default.stonks1d
(
    `sym` LowCardinality(String),
    `volume` UInt64 CODEC(T64, ZSTD(1)),
    `vw` Float32 CODEC(ZSTD(1)),
    `open` Float32 CODEC(ZSTD(1)),
    `high` Float32 CODEC(ZSTD(1)),
    `low` Float32 CODEC(ZSTD(1)),
    `close` Float32 CODEC(ZSTD(1)),
    `time` DateTime('US/Eastern') CODEC(DoubleDelta, ZSTD(1)),
    `count` UInt64 CODEC(T64, ZSTD(1))
)
ENGINE = ReplacingMergeTree
ORDER BY (sym, time)
SETTINGS index_granularity = 8192
It’s really simple. The data just looks like:
SELECT *
FROM stonks1d
WHERE sym IN ('AAPL', 'MSFT', 'GOOGL', 'TLT', 'QQQ', 'IWM')
ORDER BY time DESC
LIMIT 24

Query id: 09efdc63-fd8f-4ea3-b708-4bf37ac96a49

┌─sym───┬───volume─┬───────vw─┬────open─┬─────high─┬──────low─┬──close─┬────────────────time─┬──count─┐
│ AAPL  │ 59710594 │ 219.0872 │     224 │    224.8 │   217.13 │ 218.54 │ 2024-07-24 16:00:00 │ 816079 │
│ GOOGL │ 49236617 │ 173.4416 │   173.6 │   176.19 │   171.82 │ 172.63 │ 2024-07-24 16:00:00 │ 770580 │
│ IWM   │ 42686981 │ 220.7114 │  221.07 │   223.86 │  217.715 │ 217.85 │ 2024-07-24 16:00:00 │ 284421 │
│ MSFT  │ 25907715 │ 431.1135 │  440.45 │   441.48 │  427.585 │  428.9 │ 2024-07-24 16:00:00 │ 550643 │
│ QQQ   │ 58763854 │ 468.5239 │  473.82 │   474.19 │   462.51 │ 463.38 │ 2024-07-24 16:00:00 │ 515503 │
│ TLT   │ 50729868 │  92.0078 │   92.59 │    92.85 │    91.47 │  91.52 │ 2024-07-24 16:00:00 │ 144712 │
│ GOOGL │ 36072809 │ 182.4427 │  182.05 │   183.61 │   181.54 │ 181.79 │ 2024-07-23 16:00:00 │ 527764 │
│ AAPL  │ 38199146 │ 225.0217 │ 224.365 │   226.94 │   222.68 │ 225.01 │ 2024-07-23 16:00:00 │ 551306 │
│ MSFT  │ 12397870 │ 445.2345 │ 443.895 │   448.39 │    443.1 │ 444.85 │ 2024-07-23 16:00:00 │ 316035 │
│ IWM   │ 44947981 │ 221.7853 │  219.21 │   223.75 │   219.04 │ 222.63 │ 2024-07-23 16:00:00 │ 266305 │
│ QQQ   │ 23308151 │ 481.8894 │  481.41 │   484.43 │   480.14 │ 480.62 │ 2024-07-23 16:00:00 │ 255720 │
│ TLT   │ 23473929 │  92.8135 │   92.81 │    93.03 │    92.49 │  92.52 │ 2024-07-23 16:00:00 │  70328 │
│ AAPL  │ 45015337 │ 225.0183 │  227.01 │   227.78 │   223.09 │ 223.96 │ 2024-07-22 16:00:00 │ 704839 │
│ GOOGL │ 22671816 │ 181.7079 │  180.59 │    182.7 │   180.23 │ 181.67 │ 2024-07-22 16:00:00 │ 375215 │
│ IWM   │ 35443393 │ 218.3378 │  217.68 │ 220.6499 │   215.38 │ 220.29 │ 2024-07-22 16:00:00 │ 242578 │
│ MSFT  │ 14941314 │ 442.5637 │  441.79 │    444.6 │ 438.9125 │ 442.94 │ 2024-07-22 16:00:00 │ 405583 │
│ QQQ   │ 40286054 │  480.746 │  481.16 │   483.35 │ 477.7068 │ 482.32 │ 2024-07-22 16:00:00 │ 349672 │
│ TLT   │ 36159529 │  92.8746 │    93.4 │    93.52 │     92.3 │  92.65 │ 2024-07-22 16:00:00 │  96722 │
│ AAPL  │ 48161116 │ 224.7453 │  224.82 │    226.8 │  223.275 │ 224.31 │ 2024-07-19 16:00:00 │ 612745 │
│ GOOGL │ 18413818 │ 178.3895 │  178.88 │   180.29 │   177.13 │ 177.66 │ 2024-07-19 16:00:00 │ 325137 │
│ IWM   │ 37890672 │ 217.1432 │  217.63 │   218.65 │   215.85 │ 216.84 │ 2024-07-19 16:00:00 │ 234736 │
│ MSFT  │ 20397724 │ 436.7082 │   433.1 │   441.14 │      432 │ 437.11 │ 2024-07-19 16:00:00 │ 483390 │
│ QQQ   │ 42063539 │ 476.8634 │  479.15 │   481.69 │   473.94 │ 475.24 │ 2024-07-19 16:00:00 │ 363718 │
│ TLT   │ 32129364 │  92.9888 │   93.04 │    93.16 │    92.82 │  92.92 │ 2024-07-19 16:00:00 │  77558 │
└───────┴──────────┴──────────┴─────────┴──────────┴──────────┴────────┴─────────────────────┴────────┘

24 rows in set. Elapsed: 0.068 sec. Processed 57.34 thousand rows, 2.03 MB (839.72 thousand rows/s., 29.68 MB/s.)
Peak memory usage: 32.44 KiB.
You can also use bulk saved market data for things like experiments in training market data neural networks.
Sample Query Over Historical Prices
We can also generate different kinds of historical lookback reports to combine with real time alerting:
SELECT
    min(low) OVER (ROWS BETWEEN 29 PRECEDING AND CURRENT ROW) AS `Low=29`,
    min(low) OVER (ROWS BETWEEN 28 PRECEDING AND CURRENT ROW) AS `Low=28`,
    min(low) OVER (ROWS BETWEEN 27 PRECEDING AND CURRENT ROW) AS `Low=27`,
    min(low) OVER (ROWS BETWEEN 26 PRECEDING AND CURRENT ROW) AS `Low=26`,
    min(low) OVER (ROWS BETWEEN 25 PRECEDING AND CURRENT ROW) AS `Low=25`,
    min(low) OVER (ROWS BETWEEN 24 PRECEDING AND CURRENT ROW) AS `Low=24`,
    min(low) OVER (ROWS BETWEEN 23 PRECEDING AND CURRENT ROW) AS `Low=23`,
    min(low) OVER (ROWS BETWEEN 22 PRECEDING AND CURRENT ROW) AS `Low=22`,
    min(low) OVER (ROWS BETWEEN 21 PRECEDING AND CURRENT ROW) AS `Low=21`,
    min(low) OVER (ROWS BETWEEN 20 PRECEDING AND CURRENT ROW) AS `Low=20`,
    min(low) OVER (ROWS BETWEEN 19 PRECEDING AND CURRENT ROW) AS `Low=19`,
    min(low) OVER (ROWS BETWEEN 18 PRECEDING AND CURRENT ROW) AS `Low=18`,
    min(low) OVER (ROWS BETWEEN 17 PRECEDING AND CURRENT ROW) AS `Low=17`,
    min(low) OVER (ROWS BETWEEN 16 PRECEDING AND CURRENT ROW) AS `Low=16`,
    min(low) OVER (ROWS BETWEEN 15 PRECEDING AND CURRENT ROW) AS `Low=15`,
    min(low) OVER (ROWS BETWEEN 14 PRECEDING AND CURRENT ROW) AS `Low=14`,
    min(low) OVER (ROWS BETWEEN 13 PRECEDING AND CURRENT ROW) AS `Low=13`,
    min(low) OVER (ROWS BETWEEN 12 PRECEDING AND CURRENT ROW) AS `Low=12`,
    min(low) OVER (ROWS BETWEEN 11 PRECEDING AND CURRENT ROW) AS `Low=11`,
    min(low) OVER (ROWS BETWEEN 10 PRECEDING AND CURRENT ROW) AS `Low=10`,
    min(low) OVER (ROWS BETWEEN 9 PRECEDING AND CURRENT ROW) AS `Low=9`,
    min(low) OVER (ROWS BETWEEN 8 PRECEDING AND CURRENT ROW) AS `Low=8`,
    min(low) OVER (ROWS BETWEEN 7 PRECEDING AND CURRENT ROW) AS `Low=7`,
    min(low) OVER (ROWS BETWEEN 6 PRECEDING AND CURRENT ROW) AS `Low=6`,
    min(low) OVER (ROWS BETWEEN 5 PRECEDING AND CURRENT ROW) AS `Low=5`,
    min(low) OVER (ROWS BETWEEN 4 PRECEDING AND CURRENT ROW) AS `Low=4`,
    min(low) OVER (ROWS BETWEEN 3 PRECEDING AND CURRENT ROW) AS `Low=3`,
    min(low) OVER (ROWS BETWEEN 2 PRECEDING AND CURRENT ROW) AS `Low=2`,
    min(low) OVER (ROWS BETWEEN 1 PRECEDING AND CURRENT ROW) AS `Low=1`,
    max(high) OVER (ROWS BETWEEN 29 PRECEDING AND CURRENT ROW) AS `High=29`,
    max(high) OVER (ROWS BETWEEN 28 PRECEDING AND CURRENT ROW) AS `High=28`,
    max(high) OVER (ROWS BETWEEN 27 PRECEDING AND CURRENT ROW) AS `High=27`,
    max(high) OVER (ROWS BETWEEN 26 PRECEDING AND CURRENT ROW) AS `High=26`,
    max(high) OVER (ROWS BETWEEN 25 PRECEDING AND CURRENT ROW) AS `High=25`,
    max(high) OVER (ROWS BETWEEN 24 PRECEDING AND CURRENT ROW) AS `High=24`,
    max(high) OVER (ROWS BETWEEN 23 PRECEDING AND CURRENT ROW) AS `High=23`,
    max(high) OVER (ROWS BETWEEN 22 PRECEDING AND CURRENT ROW) AS `High=22`,
    max(high) OVER (ROWS BETWEEN 21 PRECEDING AND CURRENT ROW) AS `High=21`,
    max(high) OVER (ROWS BETWEEN 20 PRECEDING AND CURRENT ROW) AS `High=20`,
    max(high) OVER (ROWS BETWEEN 19 PRECEDING AND CURRENT ROW) AS `High=19`,
    max(high) OVER (ROWS BETWEEN 18 PRECEDING AND CURRENT ROW) AS `High=18`,
    max(high) OVER (ROWS BETWEEN 17 PRECEDING AND CURRENT ROW) AS `High=17`,
    max(high) OVER (ROWS BETWEEN 16 PRECEDING AND CURRENT ROW) AS `High=16`,
    max(high) OVER (ROWS BETWEEN 15 PRECEDING AND CURRENT ROW) AS `High=15`,
    max(high) OVER (ROWS BETWEEN 14 PRECEDING AND CURRENT ROW) AS `High=14`,
    max(high) OVER (ROWS BETWEEN 13 PRECEDING AND CURRENT ROW) AS `High=13`,
    max(high) OVER (ROWS BETWEEN 12 PRECEDING AND CURRENT ROW) AS `High=12`,
    max(high) OVER (ROWS BETWEEN 11 PRECEDING AND CURRENT ROW) AS `High=11`,
    max(high) OVER (ROWS BETWEEN 10 PRECEDING AND CURRENT ROW) AS `High=10`,
    max(high) OVER (ROWS BETWEEN 9 PRECEDING AND CURRENT ROW) AS `High=9`,
    max(high) OVER (ROWS BETWEEN 8 PRECEDING AND CURRENT ROW) AS `High=8`,
    max(high) OVER (ROWS BETWEEN 7 PRECEDING AND CURRENT ROW) AS `High=7`,
    max(high) OVER (ROWS BETWEEN 6 PRECEDING AND CURRENT ROW) AS `High=6`,
    max(high) OVER (ROWS BETWEEN 5 PRECEDING AND CURRENT ROW) AS `High=5`,
    max(high) OVER (ROWS BETWEEN 4 PRECEDING AND CURRENT ROW) AS `High=4`,
    max(high) OVER (ROWS BETWEEN 3 PRECEDING AND CURRENT ROW) AS `High=3`,
    max(high) OVER (ROWS BETWEEN 2 PRECEDING AND CURRENT ROW) AS `High=2`,
    max(high) OVER (ROWS BETWEEN 1 PRECEDING AND CURRENT ROW) AS `High=1`
FROM stonks1d
WHERE sym = 'JPM'
ORDER BY time DESC
LIMIT 1
(you may wonder why the AS names look a bit weird: it’s
because we parse the output into local data structures automatically
based on Side, Days Ago values in the column
names)
of course, practically, we build this query with automation:
MinMaxBuilder = ", ".join(
    [
        f"min(low) OVER (ROWS BETWEEN {n} PRECEDING AND CURRENT ROW) AS `Low={n}`, max(high) OVER (ROWS BETWEEN {n} PRECEDING AND CURRENT ROW) AS `High={n}`"
        for n in range(90, 0, -1)
    ]
)
rollingPriceBreaches = client.query_dataframe(
    f"""SELECT
            {MinMaxBuilder}
       FROM stonks1d FINAL
       WHERE sym = %(sym)s
       ORDER BY time DESC
       LIMIT 1""",
    params=dict(sym=sym),
)
generating results like:
Query id: c99f4d96-d973-4b19-84fe-857213b0d8cd

Row 1:
──────
Low=29:  190.88
Low=28:  190.88
Low=27:  190.88
Low=26:  190.88
Low=25:  190.88
Low=24:  190.88
Low=23:  191.42
Low=22:  192.64
Low=21:  194.13
Low=20:  194.22
Low=19:  194.22
Low=18:  196.275
Low=17:  196.275
Low=16:  196.275
Low=15:  196.9
Low=14:  199.3018
Low=13:  202.1
Low=12:  202.1
Low=11:  202.1
Low=10:  202.1
Low=9 :  202.1
Low=8 :  202.1
Low=7 :  202.1
Low=6 :  202.1
Low=5 :  202.1
Low=4 :  206.72
Low=3 :  208.08
Low=2 :  209.235
Low=1 :  209.235
High=29: 217.56
High=28: 217.56
High=27: 217.56
High=26: 217.56
High=25: 217.56
High=24: 217.56
High=23: 217.56
High=22: 217.56
High=21: 217.56
High=20: 217.56
High=19: 217.56
High=18: 217.56
High=17: 217.56
High=16: 217.56
High=15: 217.56
High=14: 217.56
High=13: 217.56
High=12: 217.56
High=11: 217.56
High=10: 217.56
High=9 : 217.56
High=8 : 217.56
High=7 : 217.56
High=6 : 217.56
High=5 : 217.56
High=4 : 217.56
High=3 : 217.56
High=2 : 217.56
High=1 : 216.635

1 row in set. Elapsed: 0.037 sec. Processed 8.19 thousand rows, 106.50 KB (220.91 thousand rows/s., 2.87 MB/s.)
Peak memory usage: 420.20 KiB.
Query id: aca10753-8da6-434d-b2d8-581adc003207
Row 1:
──────
Low=29: 461.53
Low=28: 461.53
Low=27: 461.53
Low=26: 462.03
Low=25: 471.29
Low=24: 473.82
Low=23: 473.82
Low=22: 473.82
Low=21: 473.82
Low=20: 473.82
Low=19: 473.82
Low=18: 473.82
Low=17: 475.12
Low=16: 476.255
Low=15: 476.255
Low=14: 476.255
Low=13: 476.255
Low=12: 476.27
Low=11: 476.27
Low=10: 476.27
Low=9 : 476.27
Low=8 : 476.27
Low=7 : 476.27
Low=6 : 476.27
Low=5 : 476.27
Low=4 : 476.27
Low=3 : 476.27
Low=2 : 476.27
Low=1 : 476.27
High=29: 503.52
High=28: 503.52
High=27: 503.52
High=26: 503.52
High=25: 503.52
High=24: 503.52
High=23: 503.52
High=22: 503.52
High=21: 503.52
High=20: 503.52
High=19: 503.52
High=18: 503.52
High=17: 503.52
High=16: 503.52
High=15: 503.52
High=14: 503.52
High=13: 503.52
High=12: 503.52
High=11: 503.52
High=10: 503.52
High=9 : 503.52
High=8 : 503.52
High=7 : 503.52
High=6 : 503.28
High=5 : 501.01
High=4 : 501.01
High=3 : 498.44
High=2 : 488.7984
High=1 : 485.71
1 row in set. Elapsed: 0.044 sec. Processed 8.19 thousand rows, 33.04 KB (185.65 thousand rows/s., 748.78 KB/s.)
Peak memory usage: 420.20 KiB.Query id: 24f238c2-7c4e-47fa-a0c2-baba5a90264f
Row 1:
──────
Low=29: 116.56
Low=28: 116.56
Low=27: 116.56
Low=26: 116.56
Low=25: 116.56
Low=24: 116.56
Low=23: 116.56
Low=22: 116.56
Low=21: 116.56
Low=20: 116.56
Low=19: 116.56
Low=18: 116.56
Low=17: 116.56
Low=16: 116.56
Low=15: 116.56
Low=14: 116.56
Low=13: 116.56
Low=12: 116.56
Low=11: 116.56
Low=10: 116.56
Low=9 : 116.56
Low=8 : 116.56
Low=7 : 116.56
Low=6 : 116.56
Low=5 : 116.56
Low=4 : 116.56
Low=3 : 116.56
Low=2 : 116.56
Low=1 : 116.56
High=29: 140.76
High=28: 140.76
High=27: 140.76
High=26: 140.76
High=25: 140.76
High=24: 140.76
High=23: 140.76
High=22: 140.76
High=21: 140.76
High=20: 140.76
High=19: 136.15
High=18: 136.15
High=17: 136.15
High=16: 136.15
High=15: 136.15
High=14: 136.15
High=13: 136.15
High=12: 136.15
High=11: 136.15
High=10: 136.15
High=9 : 136.15
High=8 : 136.15
High=7 : 136.15
High=6 : 136.15
High=5 : 131.92
High=4 : 131.39
High=3 : 129.04
High=2 : 122.4
High=1 : 122.4
1 row in set. Elapsed: 0.068 sec. Processed 8.19 thousand rows, 114.69 KB (120.08 thousand rows/s., 1.68 MB/s.)
Peak memory usage: 420.20 KiB.One slightly annoying part about these “high/low of N days ago”
queries: the days ago is reported in market days and
not calendar days. The query assumes your database is up to
date with the most recent previous day’s data, so it counts each row as
one previous day. Using this pattern, to convert to calendar days, you
would need a market
calendar in your API layer to read the calendar date
corresponding to N market days ago (since the
market is only 3 to 5 days per week (depending on some holidays), a “40
days ago” alert is actually around 56 calendar days ago).
But How Does The Real Time Analysis Happen
You probably noticed the alerts aren’t just repeating a market data feed. The alerts are post-processed combinations of trending data and historical data.
Here’s the layout of my current architecture (this has been built up over 5+ years of on-and-off focus and will probably continue to evolve forever… it’s not like the stock market is going away, right? kinda useful if we ever end up with “extra” money again, but the work has unlimited expansion possibilities while also remaining unrelated to actually spending money on anything).
We have all these main components all connected using mostly websocket APIs:
- Live Market Data Forwarder (LMDF)
- Connects to: live data arriving from polygon.io, tradier, or IBKR
- Provides: websocket API for sending live data to clients
- (why is this needed? market data providers only allow you to connect once per customer, so if you need to use your data in multiple internal services, you have to create your own internal pub/sub proxies)
- Option Trending Agent
- Connects to: LMDF then subscribes to relevant option symbols for trend alerting and trade signal suggestions
- Provides: websocket API for clients to receive trend alerts and trading suggestions
- Announces: changes in option direction or price anomalies to
awwdio
- Symbol Trending Agent
- Connects to: LMDF as a client
- Provides: websocket API for clients to receive trend alerts and trading suggestions
- Announces: high/low of N days ago prices, volume anomalies
- Prime Agent
- Connects to: Symbol Trending Agent
- Provides: websocket API to select which trade signal suggestions look usable then allocate buy/sell decisions based on a portfolio budget
- Announces: price high/low per day for each symbol when new ones occur
- Daily Analysis Process
- Connects to: polygon.io bulk data APIs
- Populates: Historical Database with new price data for the day. Fetches all price data across 28 cores in a distributed work queue. Takes 80 minutes per day after market close to process the new data (but that’s 80 minutes with 28 core concurrency, so it’s actually doing 32 hours of import work in 80 minutes every day when accounting for the distributed processing concurrency).
- Historical Database
- Provides: clickhouse server with daily bars and 3-minute bars for every listed stock going back 4 years. also provides summary rolling statistics and historical volatility and volume trends over every 3 minute interval between 4am and 8pm for every listed symbol.
awwdio- Provides: http API for receiving inbound speech requests
- Announces: inbound speech requests, plus its own static table(s) of timed daily event data (market pre-open/open/pre-close/close, other “data event” times or “weird times” throughout the day)
- Used by:
- Option Trending Agent
- Symbol Trending Agent
- Prime Agent
- icli
icli- Connects to: ibkr API directly (no forwarder needed)
- Potentially connects to: Symbol Trending Agent for implementing automated trading suggestions
- Potentially connects to: Prime Agent for a different kind of automated trading implementation with 2-way agent feedback
- Announces: trade open/close events with P&L details attached
Got it? No?
How about more lines (pasted the above description into claude and then cleaned it up a little more):
flowchart TD
    LMDF[Live Market Data Forwarder]
    OTA[Option Trending Agent]
    STA["Symbol\nTrending\nAgent"]
    PA[Prime Agent]
    AWWDIO[awwdio]

    HDB["Historical Database\n(price and volume and volatility)"]
    DAP["Daily\nData\nFetching"]

    MarketData[("Market Data\n(polygon.io, tradier, IBKR)")]

    LMDF -->|"Live market data API\n(websockets or binary)"| MarketData
    OTA -->|Websocket API| LMDF
    STA -->|Websockets API| LMDF
    STA -->|clickhouse client|HDB
    PA -->|Websocket API| STA
    DAP -->|distributed analysis| HDB

    OTA -->|"Option direction changes,\nPrice anomalies"| AWWDIO
    STA -->|"High/low prices,\nVolume anomalies"| AWWDIO
    PA -->|"Daily price high/low flags"| AWWDIO

    ICLI[icli]
    ICLI -->|"Trade open/close events,\nP&L details"| AWWDIO
    ICLI -.->|Potential connection| STA
    ICLI -.->|Potential connection| PA
    ICLI -->|Direct connection| MarketData
Everything
(the arrows represent which services connect as a client to other server services. the edges are actually bidirectional data flows, but the arrow direction is just which direction the data is initiated, then data is sent back in the reverse direction of the arrow (if applicable). 🤷♂️)
Minimized (cleaner; just the icli cluster removed)
Inner Components
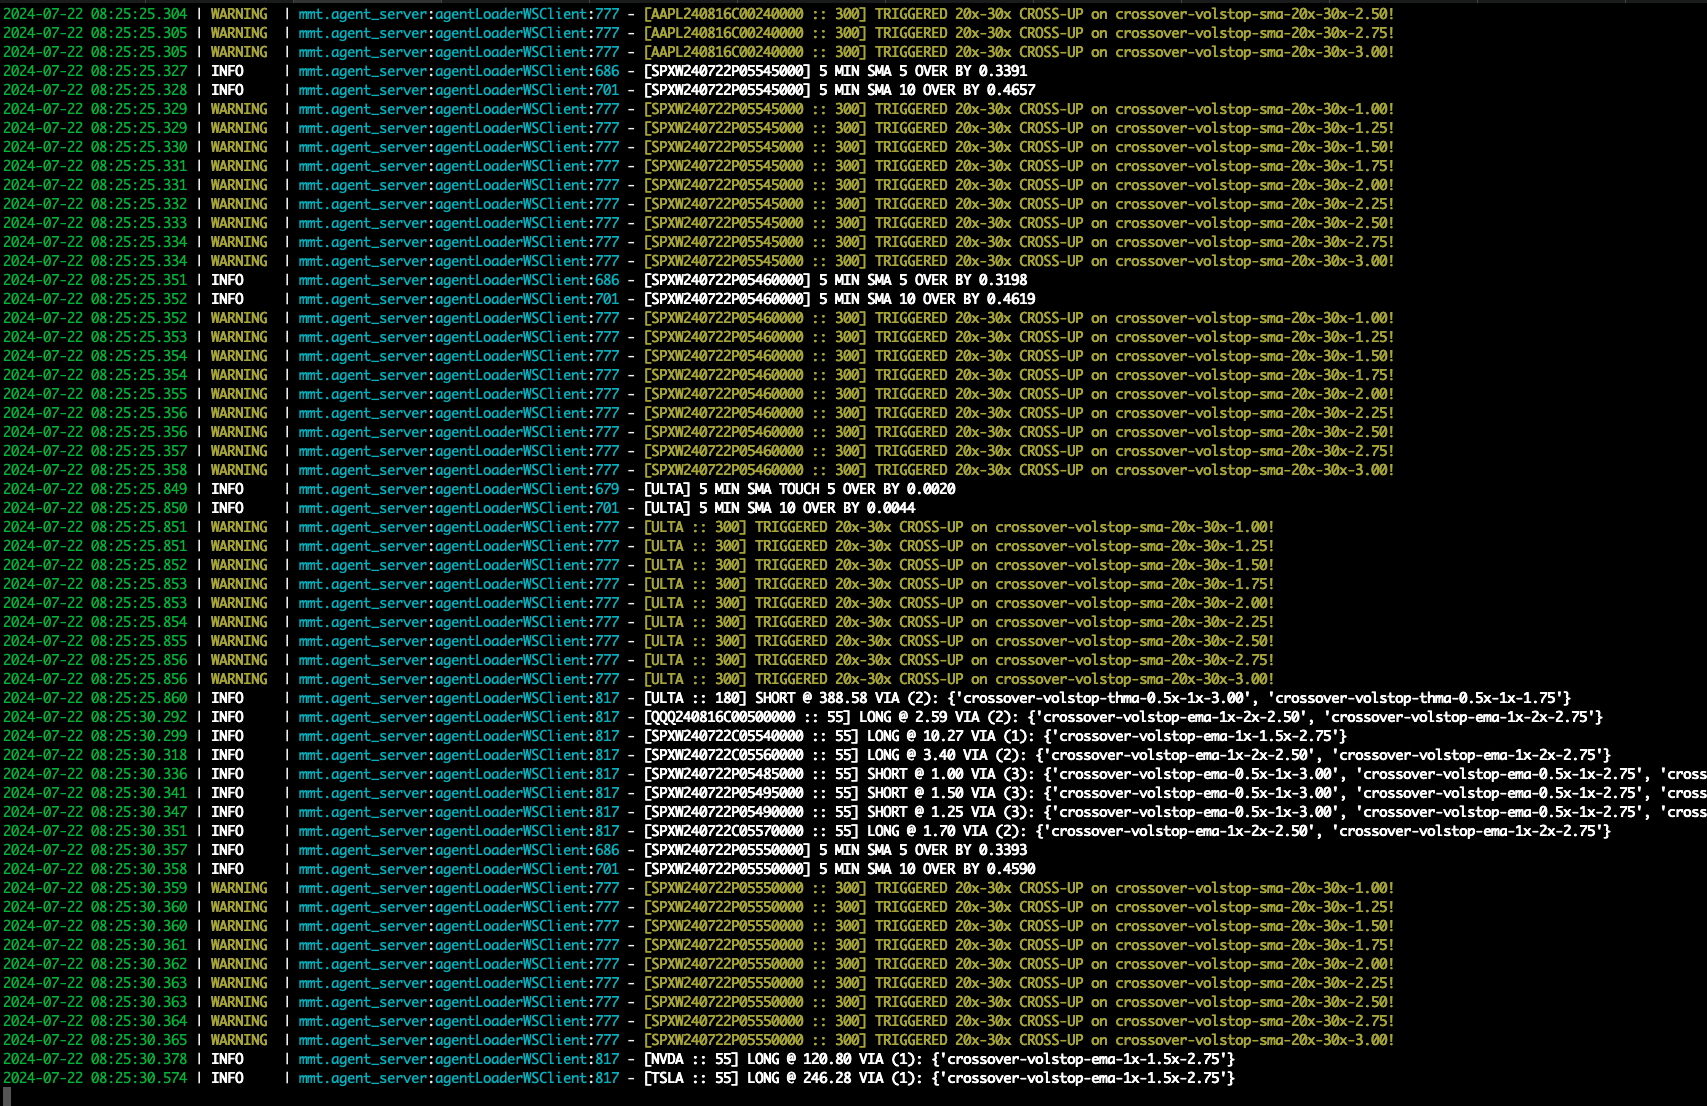
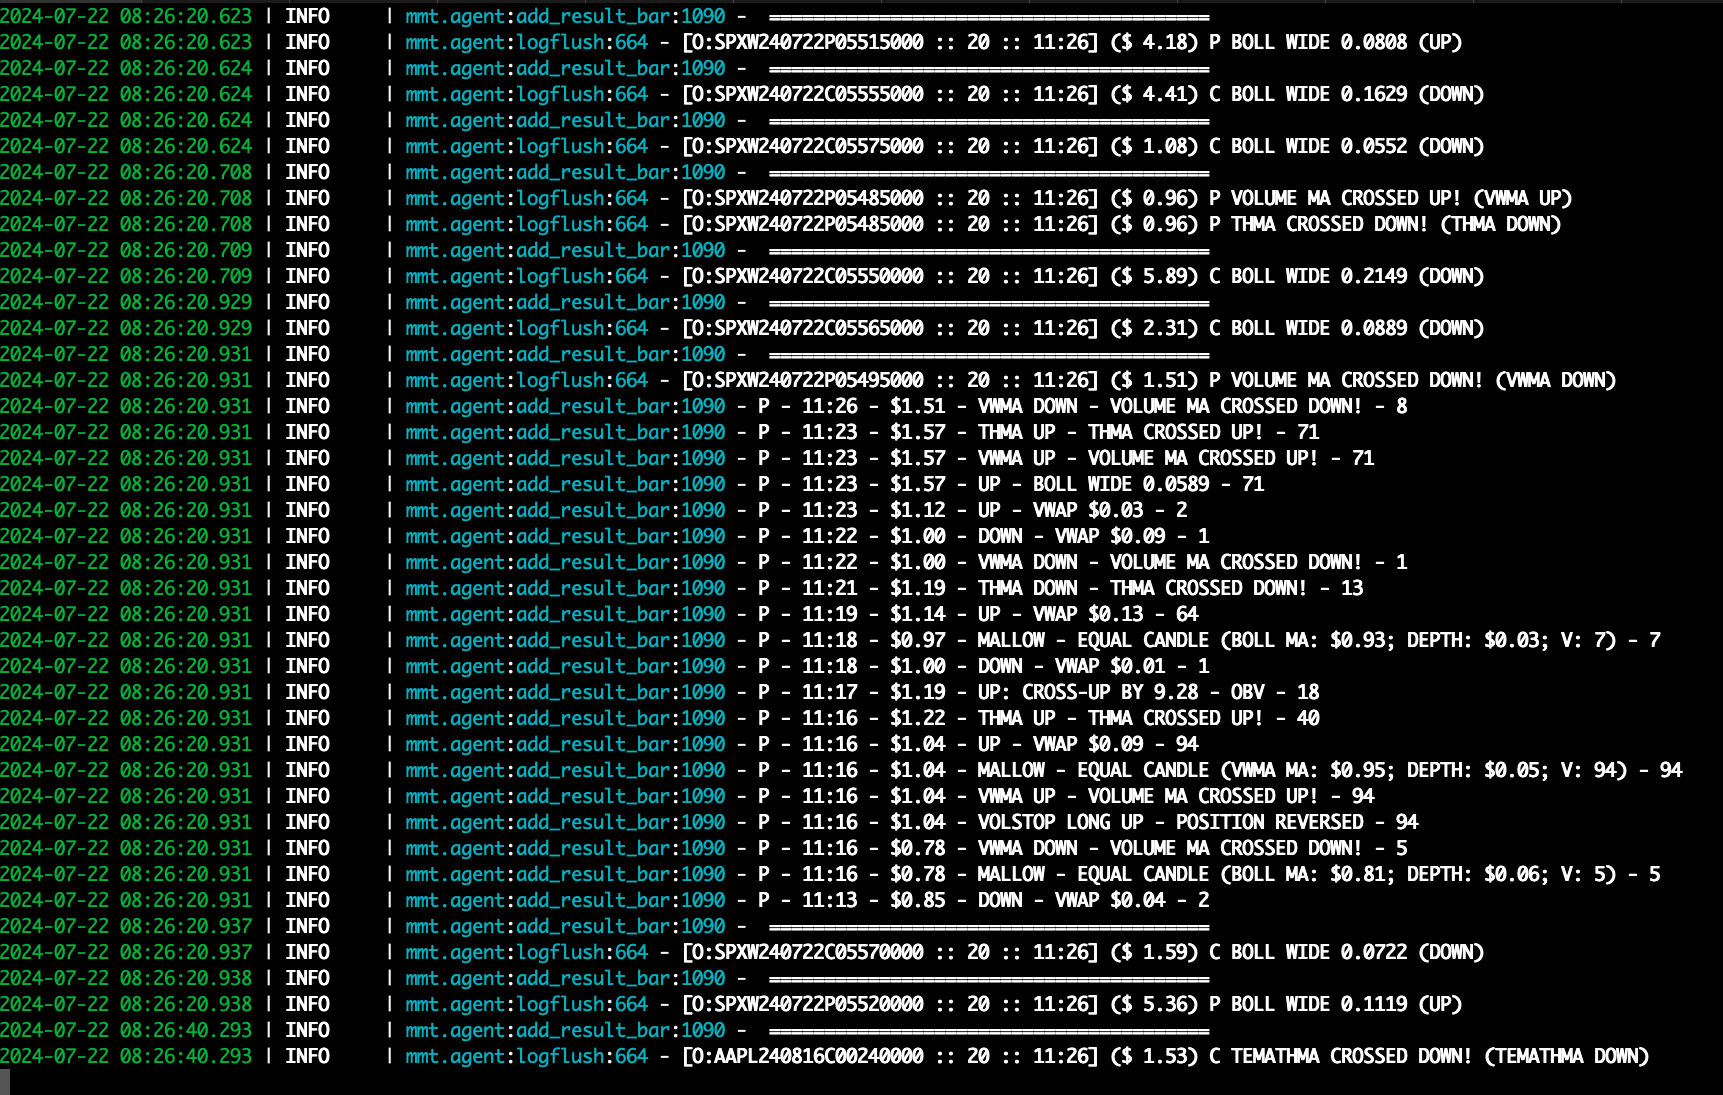
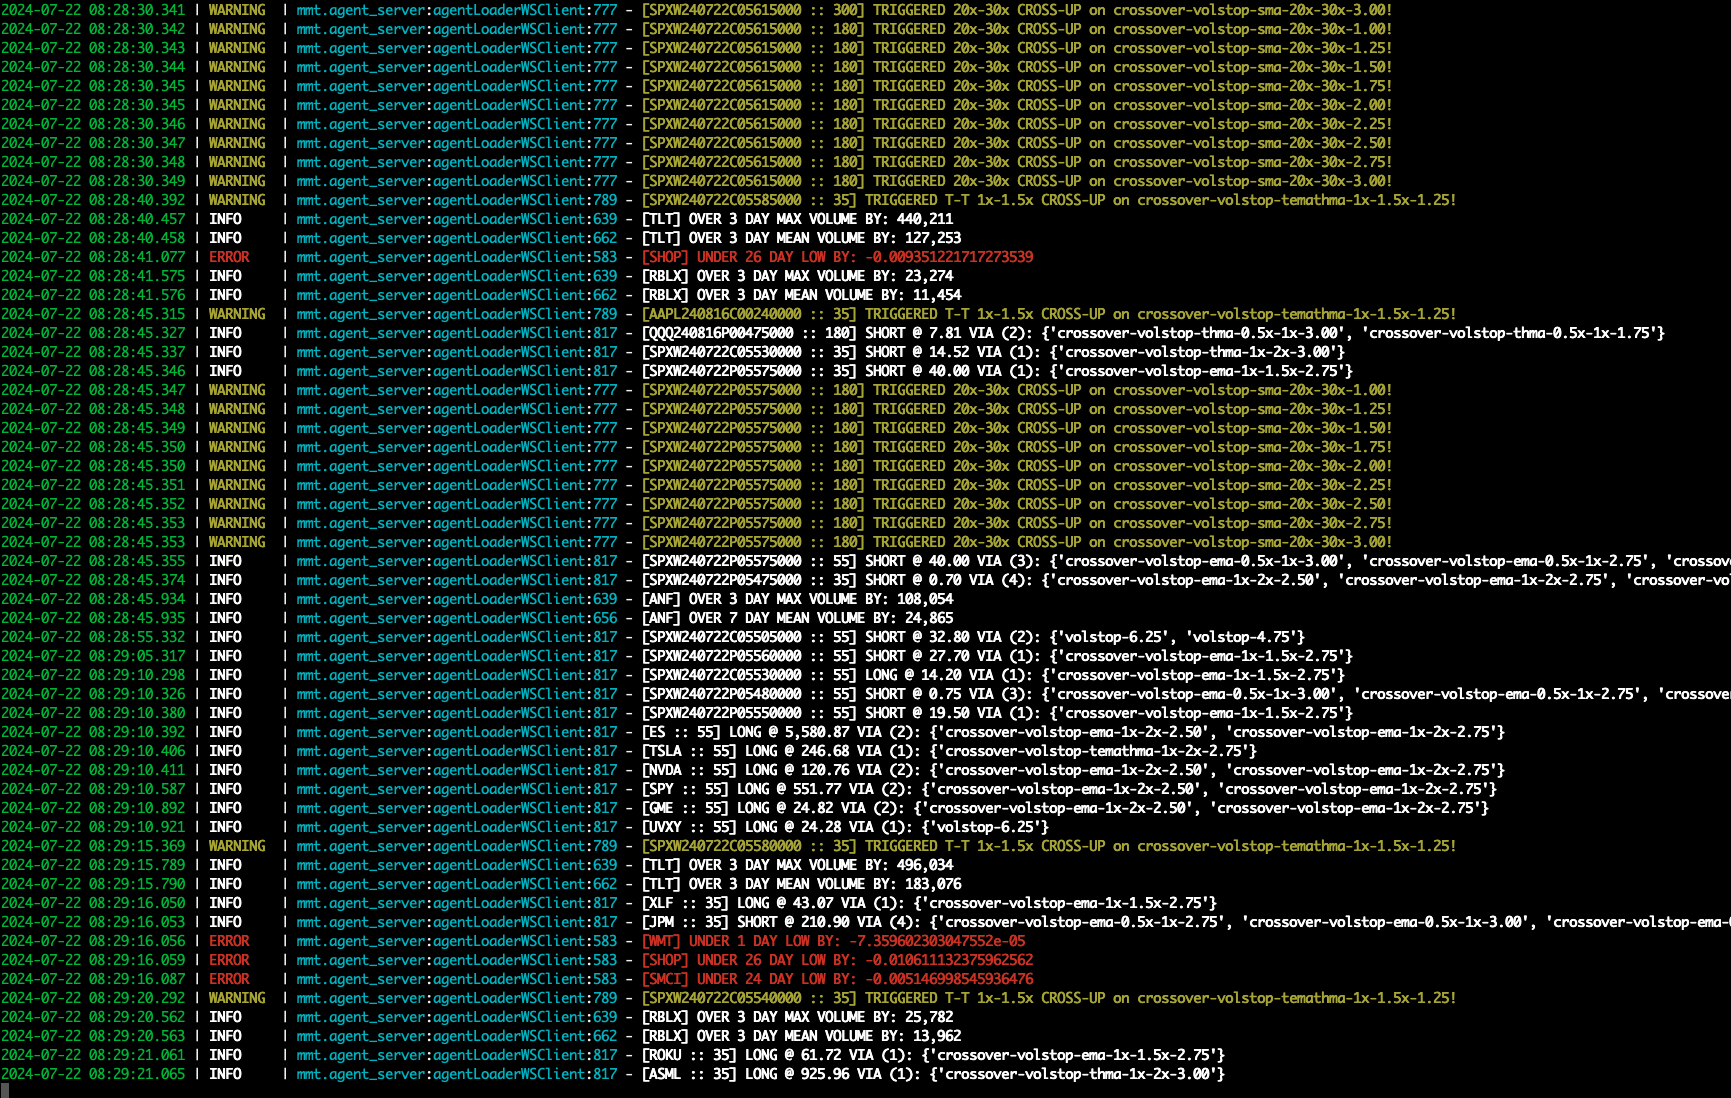
What do the inner agent-like components look like? Here’s some output snapshots from them (click for full size images):


(oh, and the mmt python package name stands for: matt’s
monetary theory 🤓)
Conclusion
Only reason for this page is just to show off more things I’ve made but haven’t released (and I can help build/maintain/refactor/grow other systems and platforms if you’re hiring people who do nice scalable work).
This entire system is tricky to release because it has so many moving parts all needing to work together (plus, continuing to release high quality uncompensated work for free makes less and less sense over time):
icliawwdio- market data forwarder
- options agent trending
- generic symbol agent trending
- prime agent analysis
- daily symbol import analysis
- custom “algo” library used by the agent systems implementing a couple dozen TA systems
- entire backtesting system which consumes an entire day of output from the symbol agent for evaluating which algos performed best for future tuning
- charting interface for backtesting system
- and probably other things i’m forgetting here?
All the components are nicely self-contained and they each expose clean APIs for other systems to consume, but it is really an “all or nothing” system where you need to run, monitor, and maintain each of the 5 main components at once.
The entire system is about 50,000 lines of python across all the data processing and live reporting and clients and servers everywhere, but organizationally it is five to eight independent systems all running at the same time and communicating with each other (so it’s not quite as simple as “run one command and everything starts together”). It would need a large refactoring pass to centralize all the systems into a “normie-friendly” use case for people who aren’t active developers in all components of the system itself.
be seeing you,
-Matt — ☁mattsta — 💰 fund fun funds
Extra Comments
Posts like this tend to bring out people who are very confident in their ignorance about criticizing things, so let’s give them a place to chat here.
If you’d like to talk about how the stock market is all random numbers and nothing can be traded for profit, leave your comments here: [ ]
If you’d like to talk about how the stock market is perfectly efficient, so any trading is at a loss, leave your comments here: [ ]
If you’d like to talk about how you need millions of dollars in HFT ASICs and direct exchange fiber connections or else nothing can possibly work, leave your comments here: [ ]
If you’d like to brag about how you bought X stock N years ago and are never selling it, leave your comment here: [ ]
If you’d like to talk about how buy-and-hold-for-40-years is the only winning move, leave your comment here: [ ]
If you’d like to complain about how the database is storing prices as floats instead of unlimited precision decimal types, please leave your comment here: [ ]
If you’d like to complain about me using Python for real time data processing, please leave your comment here: [ ]
Are we missing any other common ones?